Data Logging and its Benefits

Mike Belov • Jul 05, 2024

Data logging for electric vehicles offers numerous benefits. Firstly, it enables vehicle owners and enthusiasts to comprehensively analyse and evaluate their vehicle's performance. By recording essential parameters such as engine RPM, speed, throttle position, and braking force, among others, data logging facilitates the identification of areas for improvement, fine-tuning of vehicle settings, and tracking of performance changes over time. Furthermore, data logging serves as a valuable diagnostic and troubleshooting tool, providing crucial information about sensor readings, error codes, and system behaviour during specific events or conditions. This empowers mechanics and vehicle owners to identify problems accurately and make informed decisions regarding repairs or maintenance. 


For performance enthusiasts, data logging allows customization and optimization of vehicle settings, as continuous monitoring and logging of performance data enable precise fine-tuning of engine parameters, suspension settings, and other components. This approach helps achieve desired performance characteristics while maximizing efficiency. Importantly, data logging contributes to safety by providing insights into driver behaviour and vehicle performance, recording data related to acceleration, braking, speed, and other parameters. This information can be utilized for training purposes, monitoring driving habits, and assessing vehicle performance during critical situations. Thus, data logging proves to be an invaluable tool, offering multifaceted advantages for vehicle owners, enthusiasts, mechanics, and the automotive industry as a whole. 


When it comes to Evoke Motorcycles, collected data is used for identifying errors and potential areas of improvement in prototypes and other models. If an error or an abnormality comes up in the data, it can be easily noticed and traced to its origin, helping identify the root of the problem. Furthermore, using data brings valuable insights into driver behaviour and its variety. If one behaviour is more prevalent than the other, or there are many, the design or parameters can be manipulated to better suit the driver and make the driving experience much more pleasant and comfortable. In the future, data analytics are planned to be shifted in the hands of AI/ML providing instantaneous criteria and analysis on the go, as the data is being collected. This will fully automate the process and result in much more detailed diagnostics once the AI is sufficiently trained on the past data processes. 


All of the data is collected and stored within the vehicle, as this surpasses the limitation of servers. If the data is stored within a server in one country, a user in the other might not be able to access it. If the data is stored inside the Evoke motorcycle itself, the user can access it at any point and maintains full control of their own riding data. If there are any issues with the electric motorcycle, or the user would like to understand their riding data better, it can be easily sent to Evoke for review, bypassing any geopolitical limitations that would be otherwise present with the use of servers. The vehicle records up to 10 hours of riding data and is collected every 0.5 seconds. As of 2024, the 120 collected data points make up the five main data pools: 

Battery data: 


Batt Temp 1 - Batt Temp 6          Set Capacity          High Cell #        High Cell V          Chrg Fet Status          Up Time

    String1 -String27                        Rem Capacity          Low Cell #         Low Cell V            Balance Status             SOC


Operation data: 


Serial Time           Time          ECU Temp          Trip                      Max Speed            Reverse Mode       Mode Shift          BMS Con1

Packet Code       Date           Odo                     Efficiency          Speed (km/h)       Error Detected     Riding Mode      MCU Con2 


Stored          Input1 - Input12         Power In

Locked                                                    Outputs I2C


Inverter data: 


MCU Voltage      MCU Bus,                 MCU Status              Motor Temp      Throttle             Max Throttle        Run Send 

MCU Output       MCU Low Error      MCU High Error       Invt Temp          Max Regen       Min Throttle           Reverse


RPM            Reverse Rcv

Run Rcv      Brake Rcv 


Charger data: 


Chrg Voltage       Chrg Current         Max Current        Charging

Status Byte         Charger Conn       Max Voltage        Fast Charging 


Extras:


Roll          F Tire Pres         F Tire Temp       resetReasonCore0     TaskBluetooth      TaskBLE        TaskBusCAN     TaskBMSUART

Pitch      R Tire Pres         R Tire Temp       resetReasonCore1      TaskUpdateIO     TaskErrors    TaskBusI2C      TaskScreenUART


TaskInertialSensor           millis

TaskModeSelector


Here are some of the graphed data points on a sample ride to help users and people who are interested, analyse how the data is used. This data is crucial for Evoke Motorcycles to use when it comes to preventative maintenance and/or improving the vehicle’s range and the drivers riding experience. The data shown was collected as a result of a test drive of a prototype model M1 across the city scape of Beijing for the duration of 29 minutes. The driver weight was roughly 75kg. 
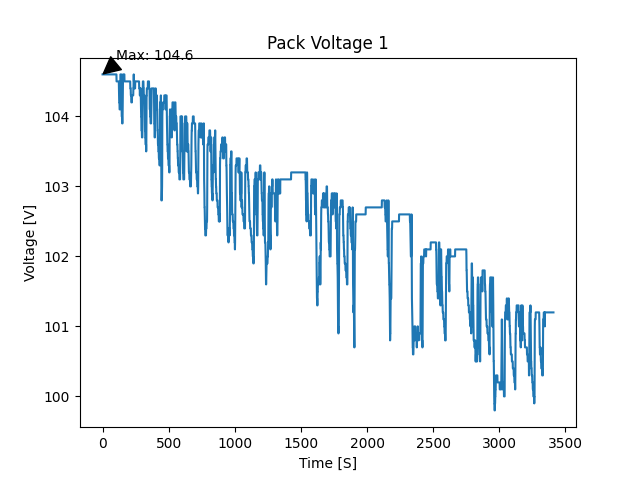


This graph shows the use of voltage in the battery, as the prototype travels. Evoke motorcycle models have ranging battery voltage. Urban Classic’s battery voltage, as well as the new prototype M1’s, sits at 113v when fully charged, while 6061-GT sits at 336.0v when full.


This data point is important because it shows  the battery voltage and how it uses up  energy dynamically. Additionally, this graph identifies that the battery is functioning as it should. 


This dynamic dips also shows the voltage drop of the pack and can extrapolate the health of the battery. Aside from the charge level, we can also estimate the battery’s age and how long it has been used for based on the full charge voltage.  


Another way in which this graph can be interpreted is the driver’s habits themselves. As the voltage fluctuations occur, they imply that the driver is revving the motor or is constantly switching speeds. This can lead to a conclusion that the driver is constantly in an urban environment in which there are bound to be constant speed fluctuations. On the highway, these fluctuations would be minimal and more constant.


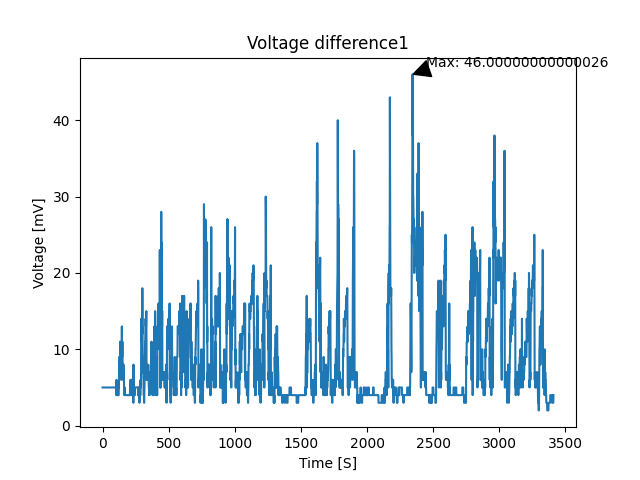
This graph shows the difference in voltage between the strongest and the weakest battery cells, the maximum reaching 46 millivolts. This data point is important because it shows how balanced the battery pack is. 


This graph also gives an insight into battery health of the vehicle. The more noticeable the voltage difference between the two cells, the worse the battery health is, and can impact range and the energy storage capacity of the pack. 


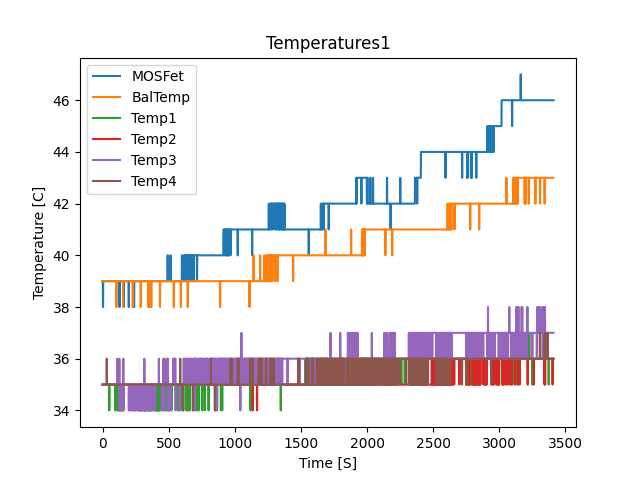
This graph provides an overview of temperature fluctuations in the battery which monitor temperature during battery charging and discharging. On the Urban Classics and M1 vehicles, there are four sensors strategically placed inside the battery to capture internal temperature variations. Analysing the lower section of the graph shows only a 2°C increase throughout the ride. 


These temperature values hold significant importance for the manufacturer, serving as reference points for determining acceptable temperature ranges during different stages of battery life. By comparing future temperature changes against this dataset abnormal temperature fluctuations can be identified, enabling prompt investigation into their underlying causes. Moreover, this graph can be a valuable resource for enthusiasts interested in analysing temperature statistics of their own vehicles. By studying the temperature patterns, they can explore methods to further enhance battery performance, such as implementing improved cooling strategies. By that, they would optimize the vehicle components to reduce energy consumption and, consequently, lower battery temperature. 

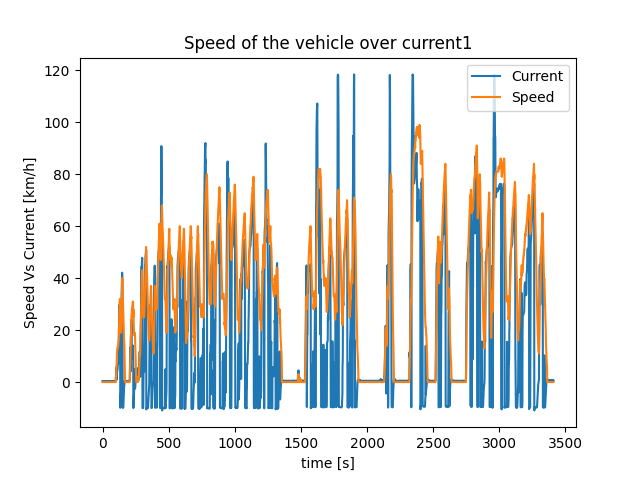
This graph shows the correlation between speed and current aka efficiency. This data is useful since it shows driver’s habits and distance travelled, and how much energy required to meet the driver's riding habits over the distance travelled.


This graph can also help identify how often the Boost Mode was used, giving the insight into the traffic and situation on the road, giving a 7s increase of power to overtake cars on the road. 


The points where the voltage goes into negative values, signal that the vehicle was in Regen mode, recharging as it decelerated. 


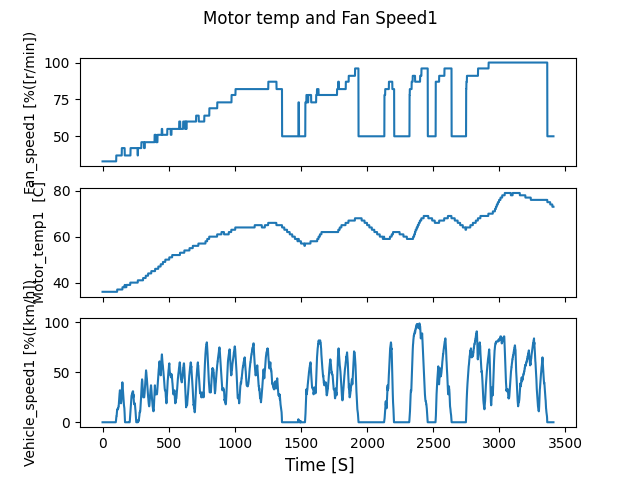
These three graphs show an overlay of three important parameters: Motor temperature, vehicle speed and fan rpm. All three data points are presented together since it indicates how well the water cooling system is working on the vehicle. 


These sets of data play a pivotal role in research and development efforts of Evoke Motorcycles in developing air, water or solid state cooling systems for electric motorcycles.


Furthermore, the activity on the graph hints at the fact that when the temperature of the motor rose, the cooling efforts of the fan and watercooling system also rose. This shows direct correlation between temperature and speed of the vehicle. Additionally, the fan’s rotation speed decreased when the vehicle speed began to drop to reduce fan noise at stoplights. 

Data like this helps us to better understand riders and riding habits, unique terrain and elevation, and localized temperatures that allows us to develop better electric motorcycles for the growing market. It can also serve as a valuable tool to assist our customers and dealers with preventative maintenance and provide insight to faults or issues that arise during ownership of an Evoke Motorcycle.

By Mike Belov 05 Jul, 2024
Data logging for electric vehicles offers numerous benefits. Firstly, it enables vehicle owners and enthusiasts to comprehensively analyse and evaluate their vehicle's performance. By recording essential parameters such as engine RPM, speed, throttle position, and braking force, among others, data logging facilitates the identification of areas for improvement, fine-tuning of vehicle settings, and tracking of performance changes over time. Furthermore, data logging serves as a valuable diagnostic and troubleshooting tool, providing crucial information about sensor readings, error codes, and system behaviour during specific events or conditions. This empowers mechanics and vehicle owners to identify problems accurately and make informed decisions regarding repairs or maintenance. For performance enthusiasts, data logging allows customization and optimization of vehicle settings, as continuous monitoring and logging of performance data enable precise fine-tuning of engine parameters, suspension settings, and other components. This approach helps achieve desired performance characteristics while maximizing efficiency. Importantly, data logging contributes to safety by providing insights into driver behaviour and vehicle performance, recording data related to acceleration, braking, speed, and other parameters. This information can be utilized for training purposes, monitoring driving habits, and assessing vehicle performance during critical situations. Thus, data logging proves to be an invaluable tool, offering multifaceted advantages for vehicle owners, enthusiasts, mechanics, and the automotive industry as a whole. When it comes to Evoke Motorcycles, collected data is used for identifying errors and potential areas of improvement in prototypes and other models. If an error or an abnormality comes up in the data, it can be easily noticed and traced to its origin, helping identify the root of the problem. Furthermore, using data brings valuable insights into driver behaviour and its variety. If one behaviour is more prevalent than the other, or there are many, the design or parameters can be manipulated to better suit the driver and make the driving experience much more pleasant and comfortable. In the future, data analytics are planned to be shifted in the hands of AI/ML providing instantaneous criteria and analysis on the go, as the data is being collected. This will fully automate the process and result in much more detailed diagnostics once the AI is sufficiently trained on the past data processes. All of the data is collected and stored within the vehicle, as this surpasses the limitation of servers. If the data is stored within a server in one country, a user in the other might not be able to access it. If the data is stored inside the Evoke motorcycle itself, the user can access it at any point and maintains full control of their own riding data. If there are any issues with the electric motorcycle, or the user would like to understand their riding data better, it can be easily sent to Evoke for review, bypassing any geopolitical limitations that would be otherwise present with the use of servers. The vehicle records up to 10 hours of riding data and is collected every 0.5 seconds. As of 2024, the 120 collected data points make up the five main data pools:
By Mike Belov 28 Jun, 2024
Vehicles, that run with combustion engines or ICEs rely on a jackshaft to efficiently distribute the produced power or simply optimise the conversion of energy to the wheels of the vehicle. ICEs cannot automatically regulate the speed of their rotation. In order to control it, different gears are introduced, to be able to increase and decrease the torque. If the jackshaft is part of a transmission system, it may have multiple gears or pulleys of different sizes attached to it. These gears or pulleys can have different ratios, allowing for torque conversion or speed adjustment. Gear ratio can be calculated via the formula below:
A black and white photo of a person crossing a crosswalk
29 Nov, 2023
With technology comes improvement in what we're used to. One of these is the development of quiet EVs. However, are they posing a threat to road users? Find out here.
A rover is parked on the surface of the moon
By Jacob Davidson 31 Jul, 2023
The Lunar Rover and its Terrestrial Cousins:  A Brief History of EVs in Space The Lunar Rover
A logo for evoke electric motorcycles is displayed on a black background
By Jacob Davidson 28 May, 2023
In terms of automotive there may be a handful of principles that determine the overall form and componentry present on a vehicle. Inescapable is physics, aspirational is performance but as another 20th century icon dictated, there's no escaping the bottom line and in manufacturing that means a need to establish and maintain a lean operational footprint.
A blue sign that says motor china on it
By Jacob Davidson 25 May, 2023
Evoke Electric Motorcycles at Motor China 2023 (Beijing International Motorcycle Exhibition)
A man is plugging an electric motorcycle into a charging station
27 Apr, 2023
When riding in places with sub-zero temperatures, some EV riders may experience non-charging of their bikes. Get the details of why this happens here.
A close-up of a blue electric motorcycle with a brown seat. Urban Classic 2022 Vienna
04 Apr, 2023
Handlebar grip wear and tear hurt the aesthetics of your bike and cause some safety issues. Here's how you can replace the handlebar grips of your Evoke Urban Classic.
Nathan Siy is riding a red urban_classic, an electric motorcycle down a road.
14 Mar, 2023
EV owners face several challenges, and one of them is limited charging stations that can impact the EV range. Learn the different factors that affect an EV's range.
More Posts
Share by: